Guide
View Live Tool Calls
Overview
The Airbyte Dashboard is your central hub for observing AI agent activity. When agents execute tool calls—requests to fetch, search, or write data through connected systems—those operations are logged and displayed on the Dashboard. This workflow helps you verify that agents are calling the right tools, understand the flow of data movement, and troubleshoot any issues with tool execution. The Dashboard provides real-time visibility into authenticated tool calls, ensuring you can monitor agent behavior safely and maintain audit trails of all connector operations.
Before you begin
- An active Airbyte account with access to app.airbyte.ai
- At least one AI agent configured and running in Airbyte Agent Engine
- At least one data connector or tool registered and exposed to your agent
Step by step
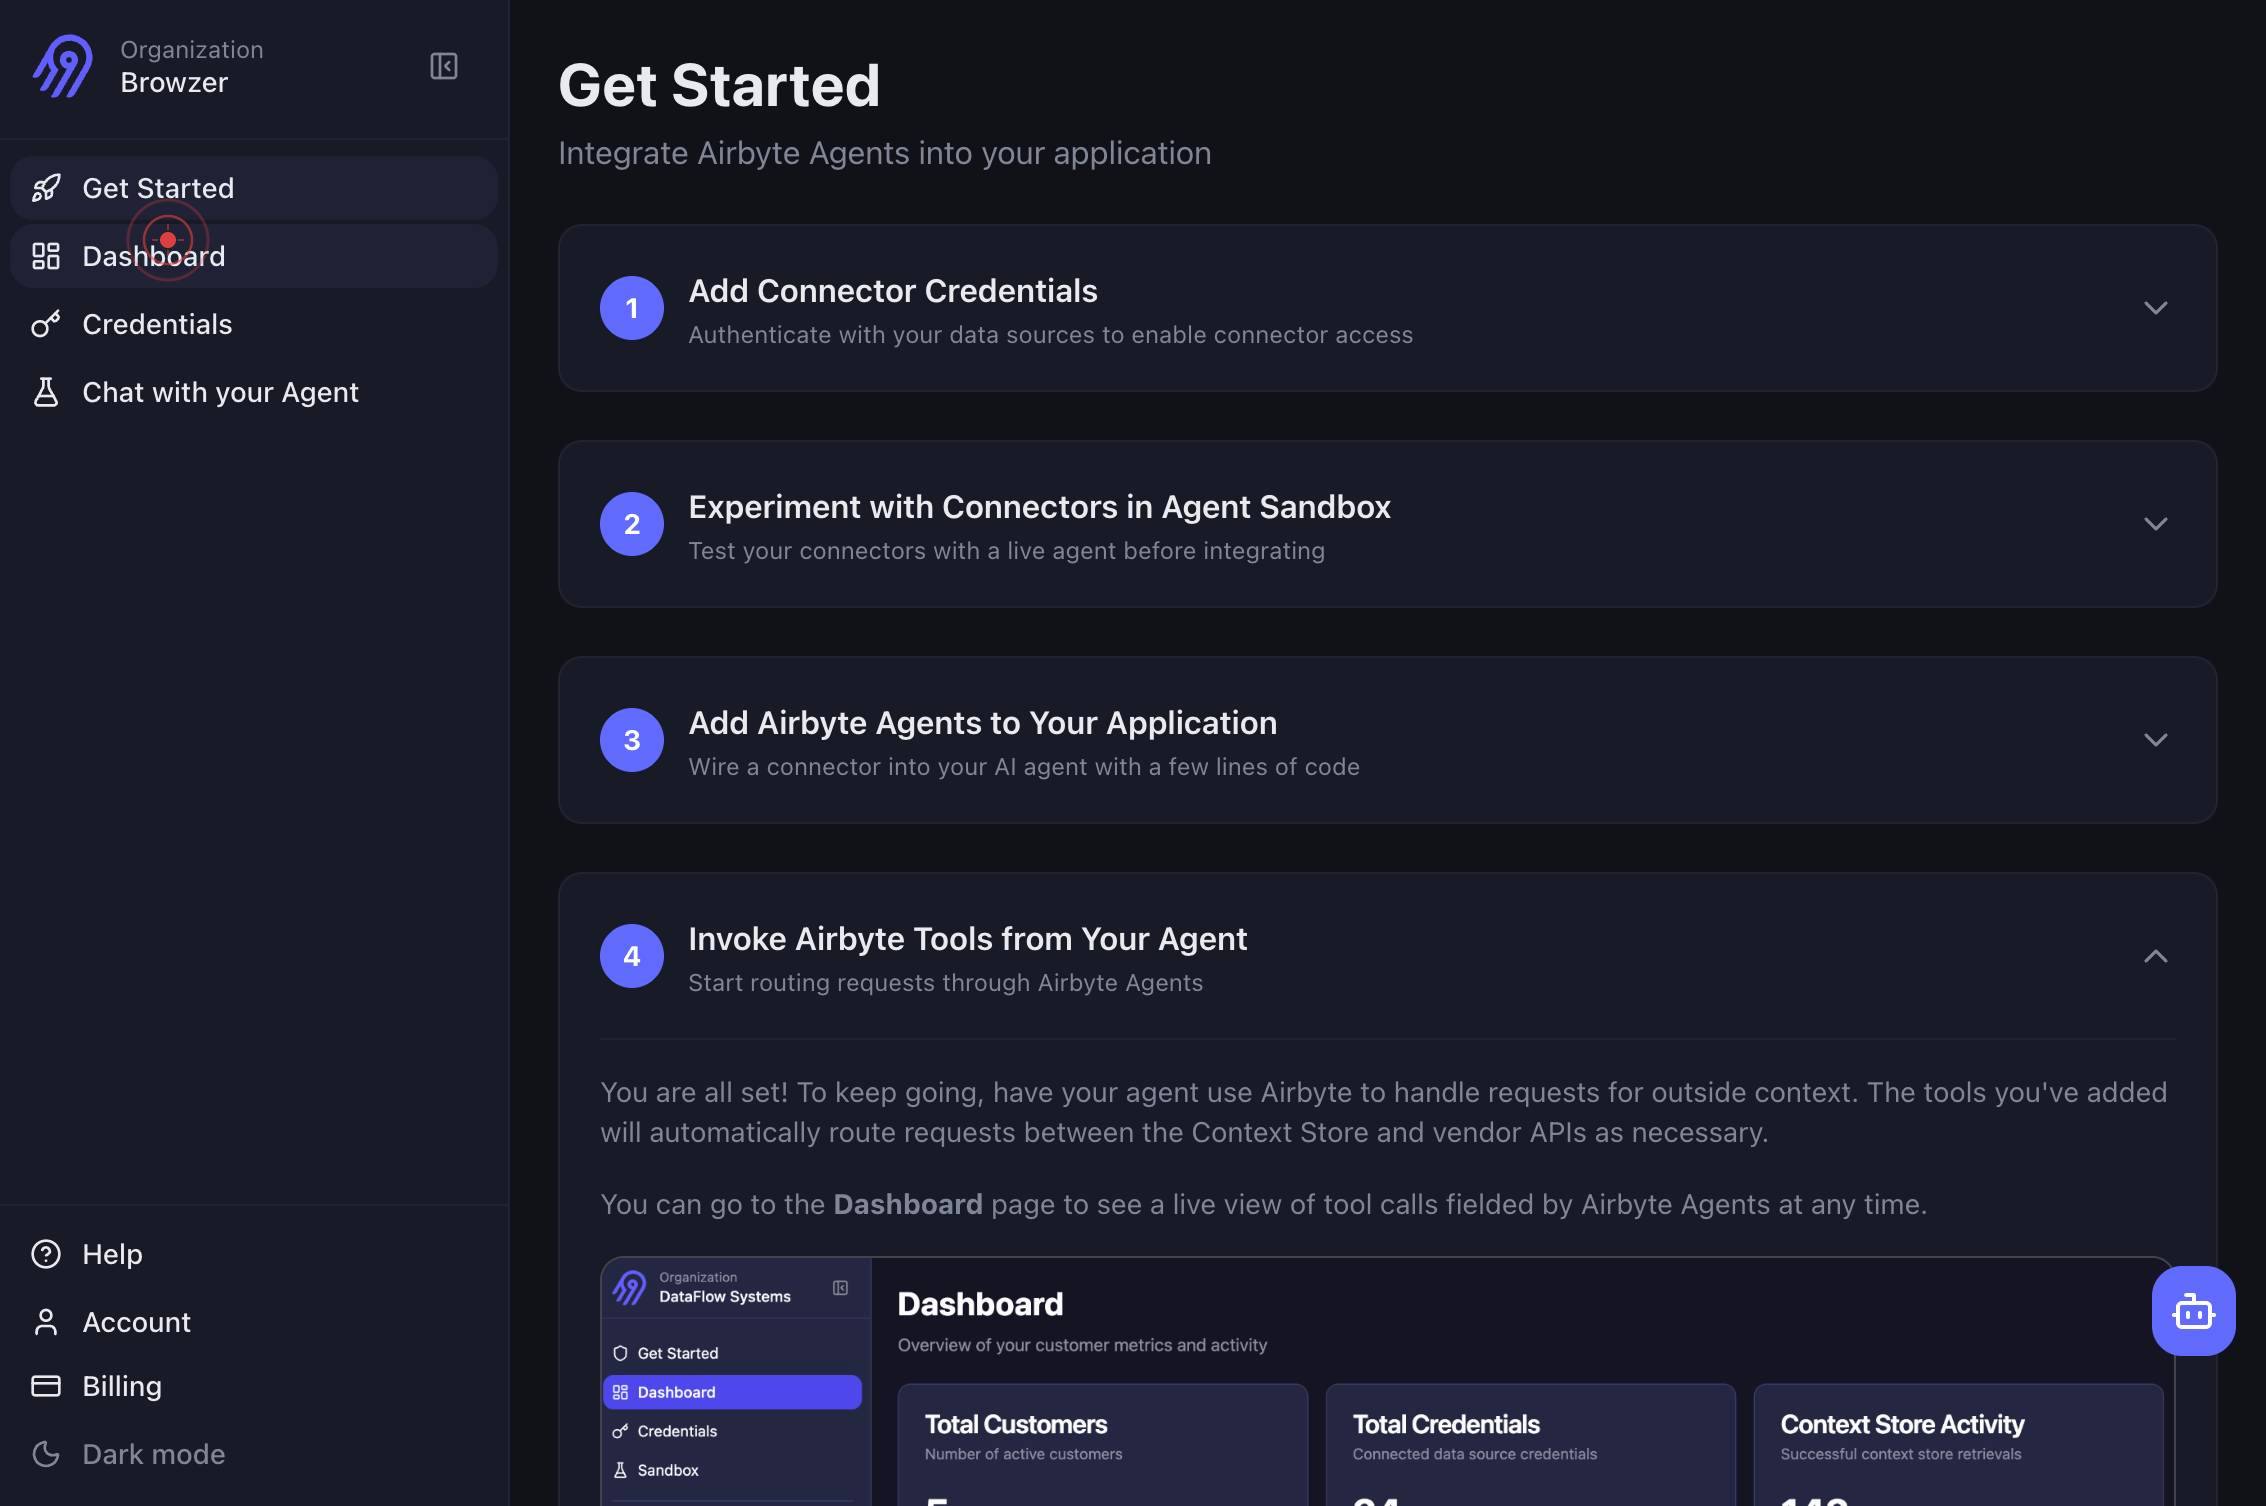
DashboardClick the Dashboard link in the main navigation to access the Airbyte Dashboard where you can view live tool calls executed by your AI agents.
Confirm it worked
- 1You are on the Airbyte Dashboard page (URL shows app.airbyte.ai/dashboard or similar)
- 2The Dashboard displays a list or timeline of recent tool calls with details such as connector name, operation type, timestamp, and status
- 3Live tool call metrics or activity feed is visible and updating in real time
Common issues
Keep reading
feat(v0.12): Live Tool Call Stream — real-time feed of tool calls across all active sessions · Issue #31 · vivekchand/clawmetry
# Issue: vivekchand/clawmetry #31 - Repository: vivekchand/clawmetry | See your agent think. Real-time observability dashboard for OpenClaw AI agents. | 275 stars | Python ## feat(v0.12): Live Tool
github.comTool definition and use | LiveKit Documentation
# LiveKit docs > LiveKit is a platform for building voice and realtime AI applications. LiveKit Cloud is the hosted commercial offering based on the open-source LiveKit project. ## Overview LiveKit
docs.livekit.ioBuilt-in tools for the Live API Stay organized with collections Save and categorize content based on your preferences.
Built-in tools for the Live API | Generative AI on Vertex AI | Google Cloud Documentation[Skip to main content](#main-content) [![Google Cloud Documentation](https://www.gstatic.com/devrel-devsite/pro
docs.cloud.google.com