Guide
Create Monitor
Overview
Monitors in Exa automatically execute your search queries on a recurring schedule, keeping your Websets updated with the latest web data without manual intervention. This is essential for applications that need real-time or near-real-time web intelligence—such as market research, competitive intelligence, or AI training data pipelines. By defining a monitor with a search query, update frequency, and optional JSON schema filtering, you enable continuous data collection that powers your live web integration.
Before you begin
- You have an active Exa account and are logged into https://dashboard.exa.ai
- You have access to the Monitors section of the dashboard (available to most account tiers)
- You have a clear search query in mind (e.g., a topic, domain, or data pattern you want to monitor)
- You understand your desired monitoring frequency (hourly, daily, etc.) based on your use case
Step by step
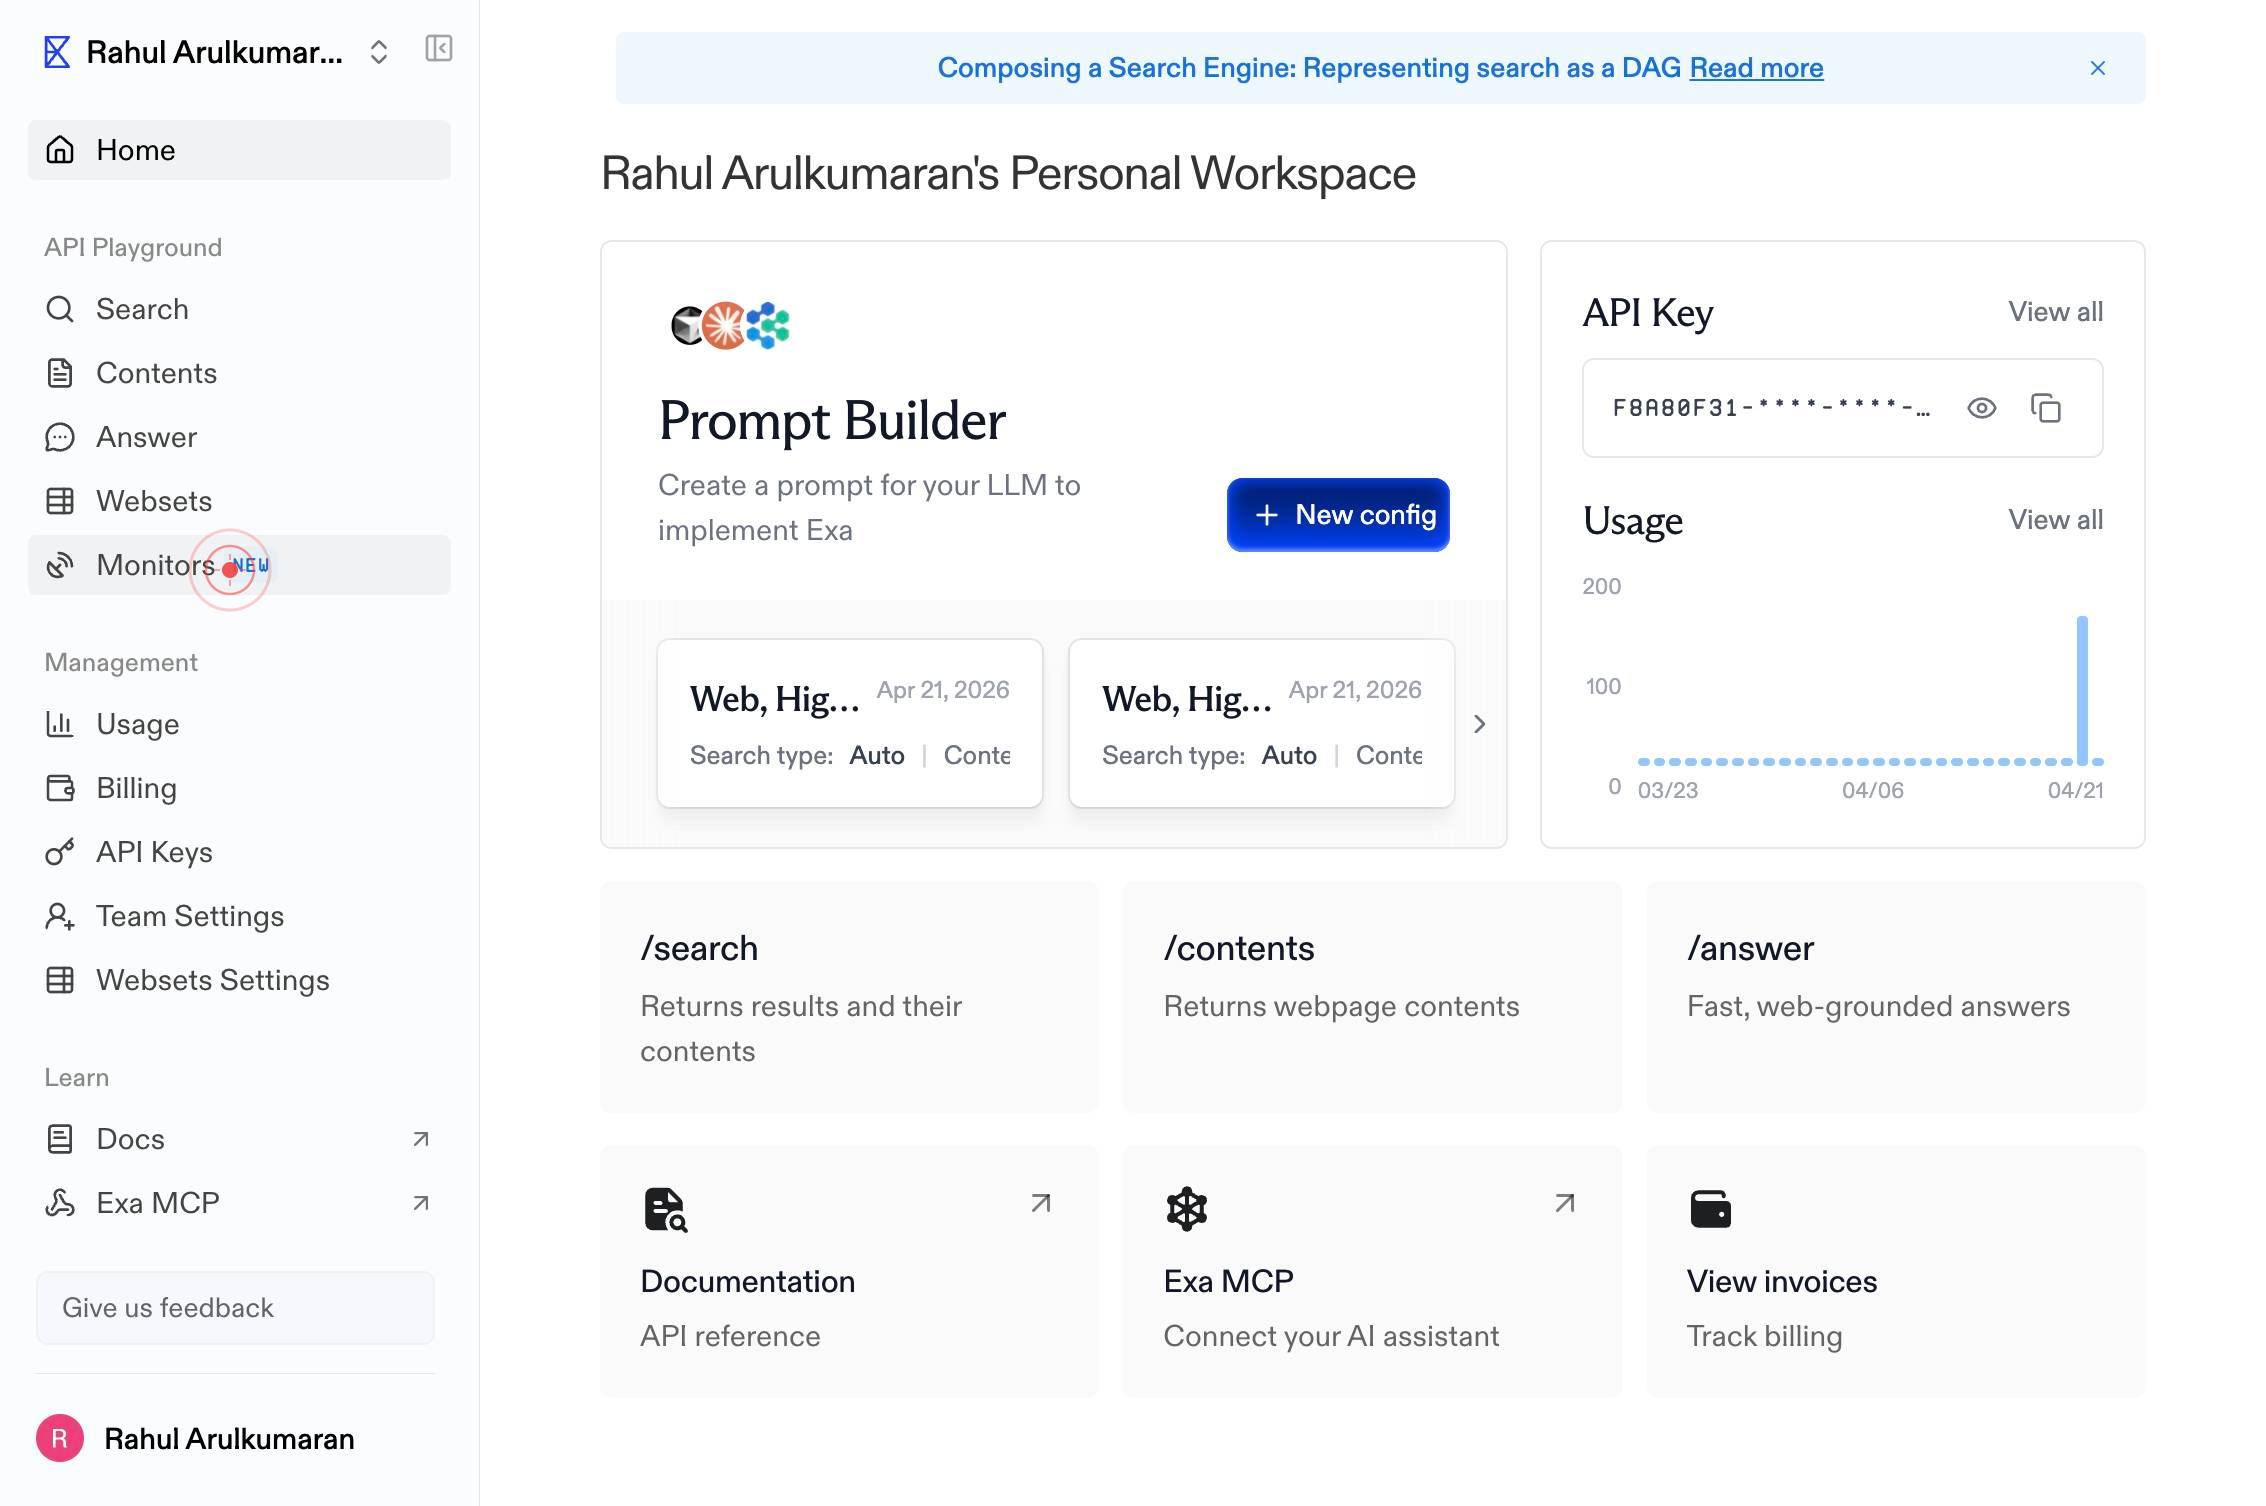
Monitors NEWNavigate to the Monitors section by clicking the 'Monitors NEW' link in the top navigation of your Exa dashboard. This opens the monitors creation interface.
Enter a search query for the monitor...Click on the search query input field (labeled 'Enter a search query for the monitor...') to focus it and prepare to enter your search criteria.
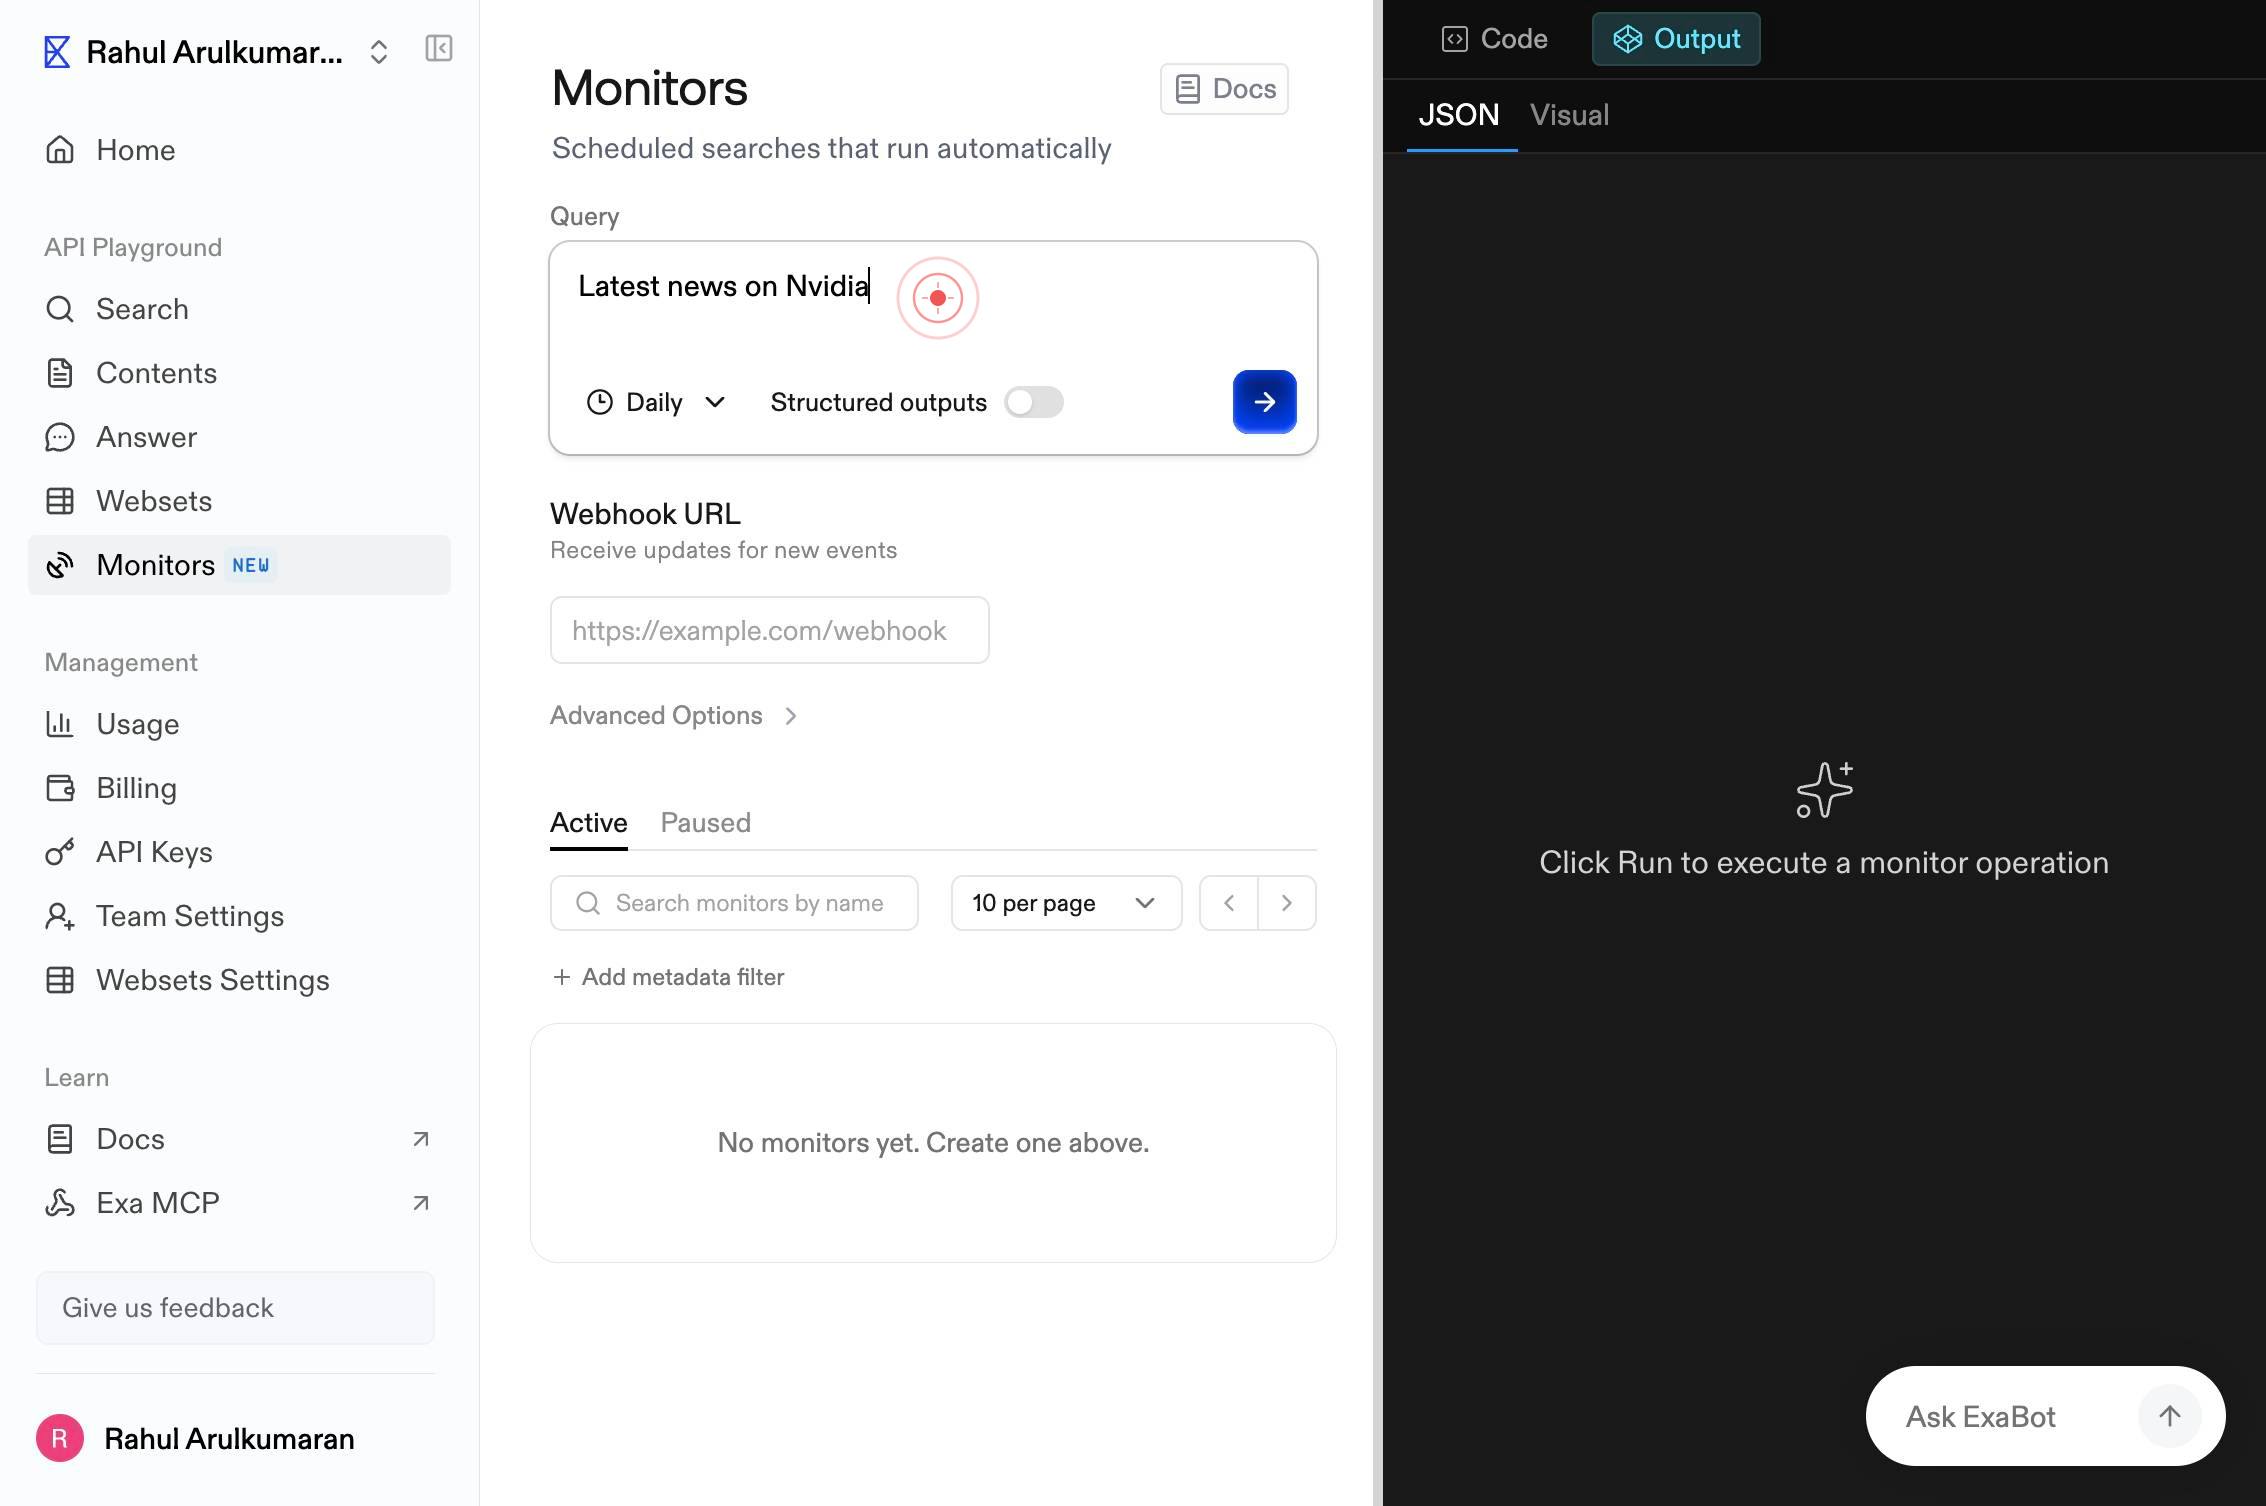
Enter a search query for the monitor...Type your search query into the textbox. This query defines what data the monitor will track (e.g., 'AI startups', 'technology news', or a specific domain). This is the core logic of your monitor.
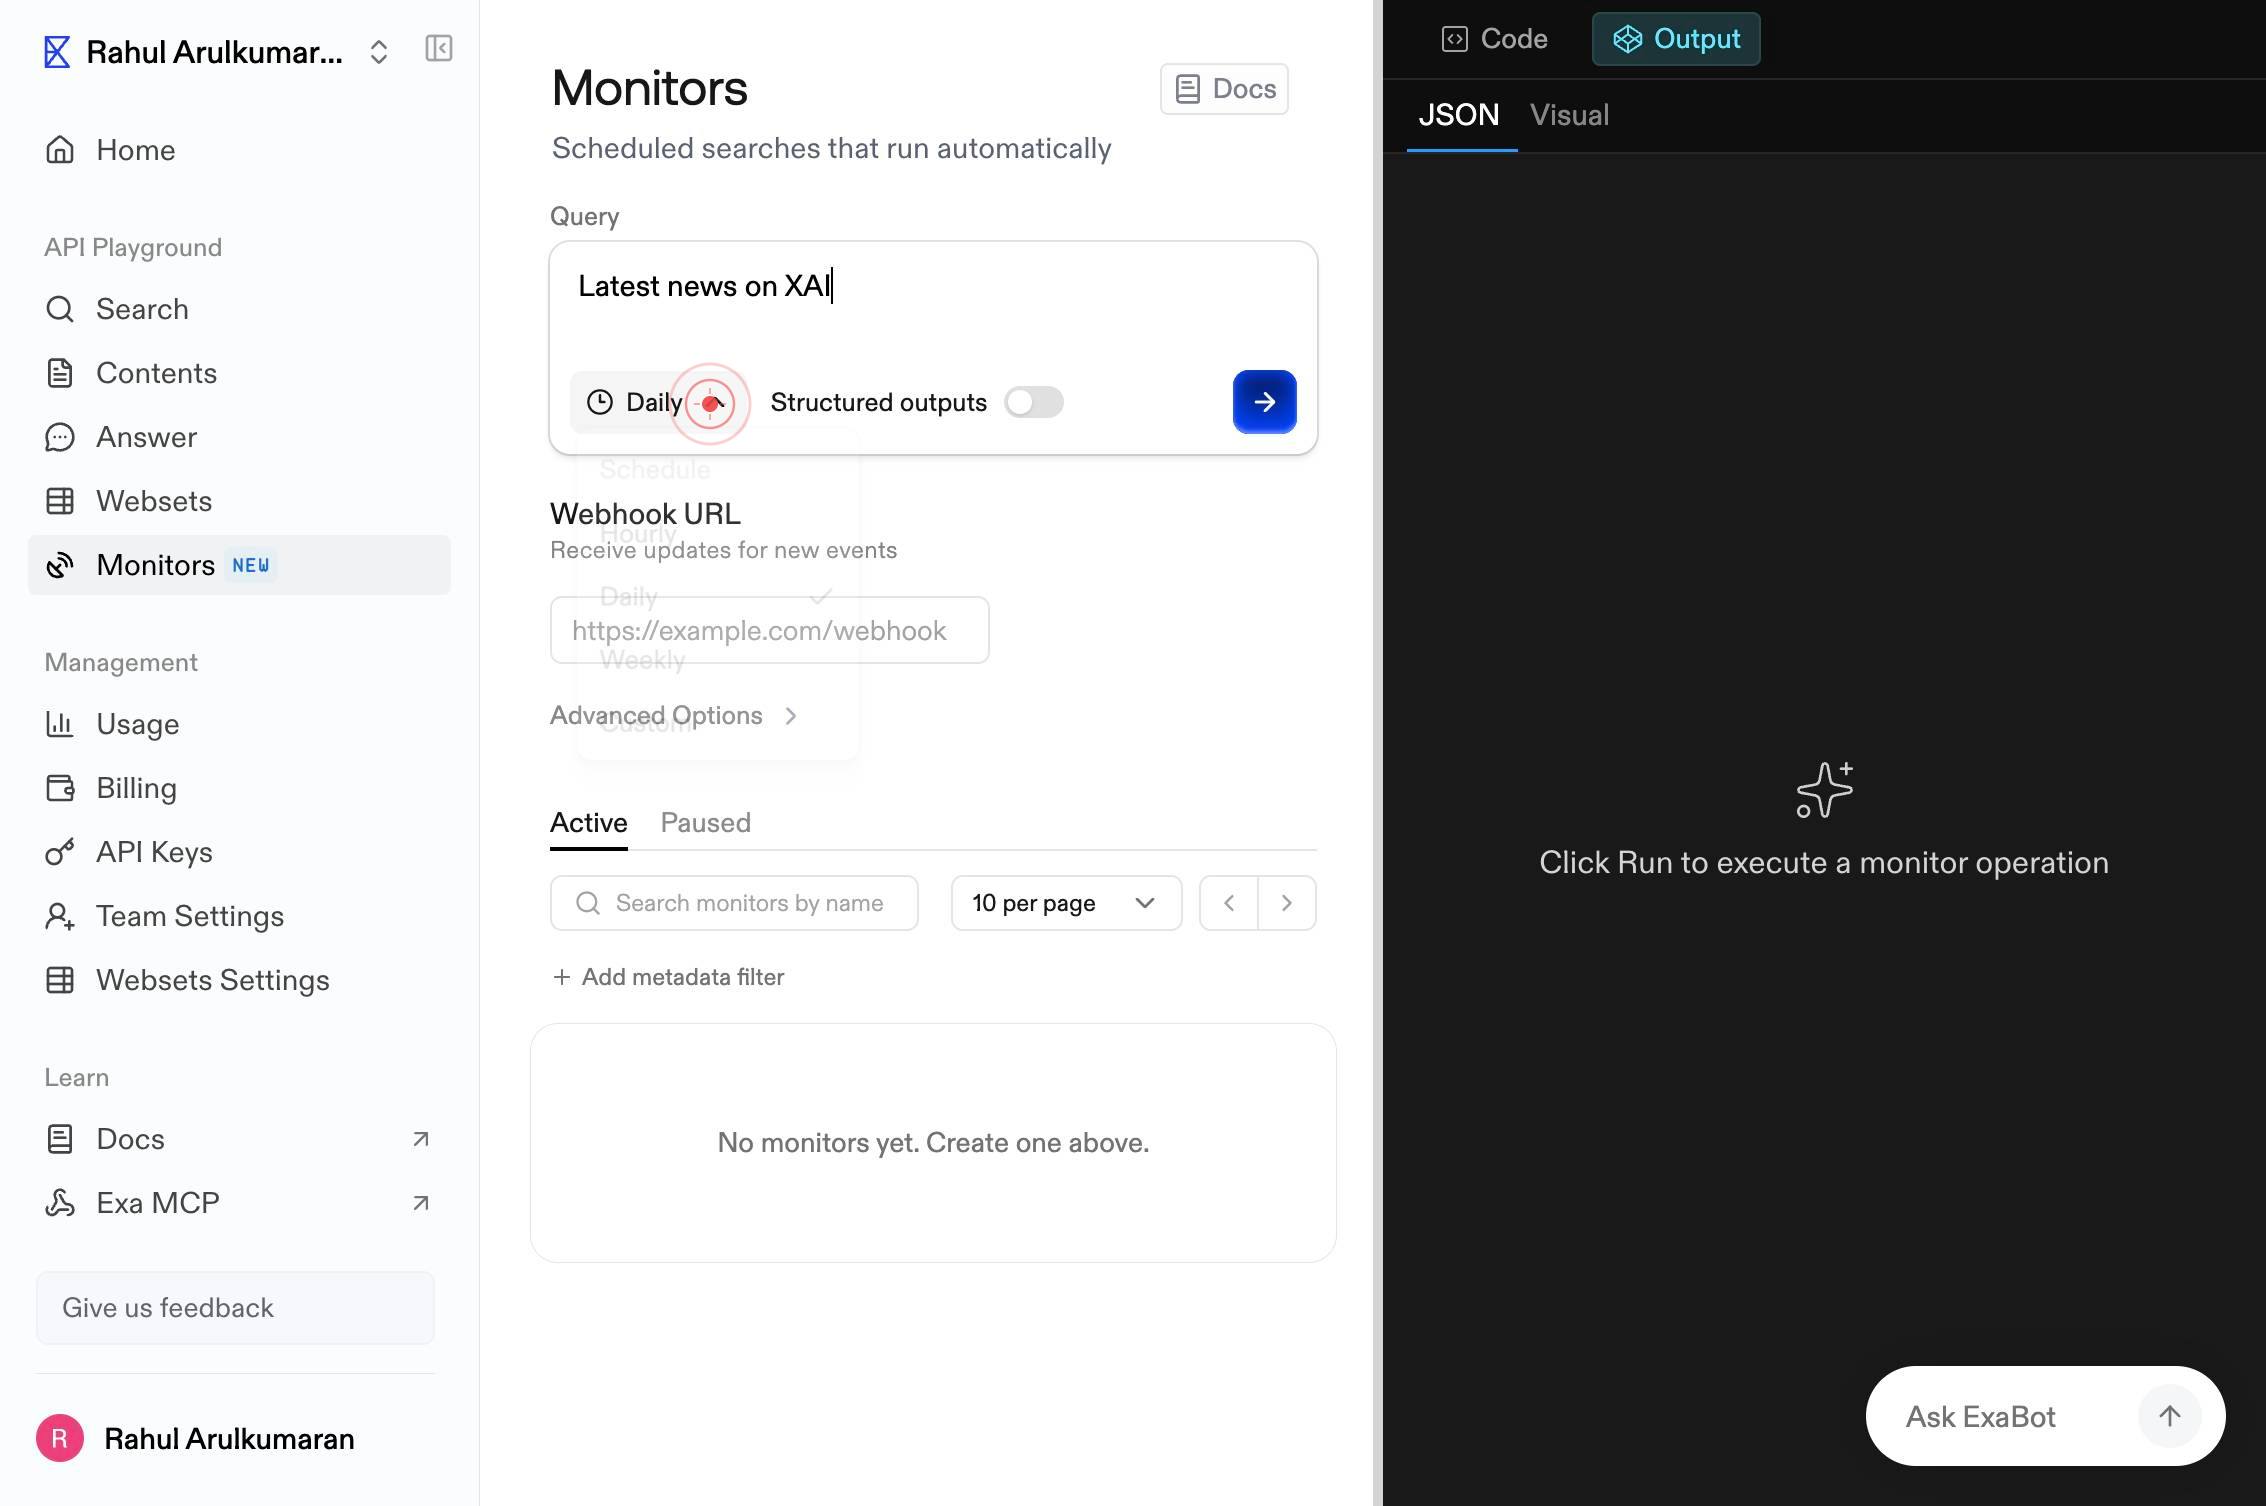
DailyClick the 'Daily' button to open the frequency selection menu. This shows the current default frequency setting.
Enter a search query for the monitor...Type additional search query refinements into the textbox if needed. The textbox remains active for further edits.
HourlyClick the 'Hourly' button to set the monitor to run every hour. This ensures frequent updates to your Webset with the latest matching data.

Enter a search query for the monitor...Type any final refinements to your search query if needed. The textbox remains editable until you proceed to the next step.
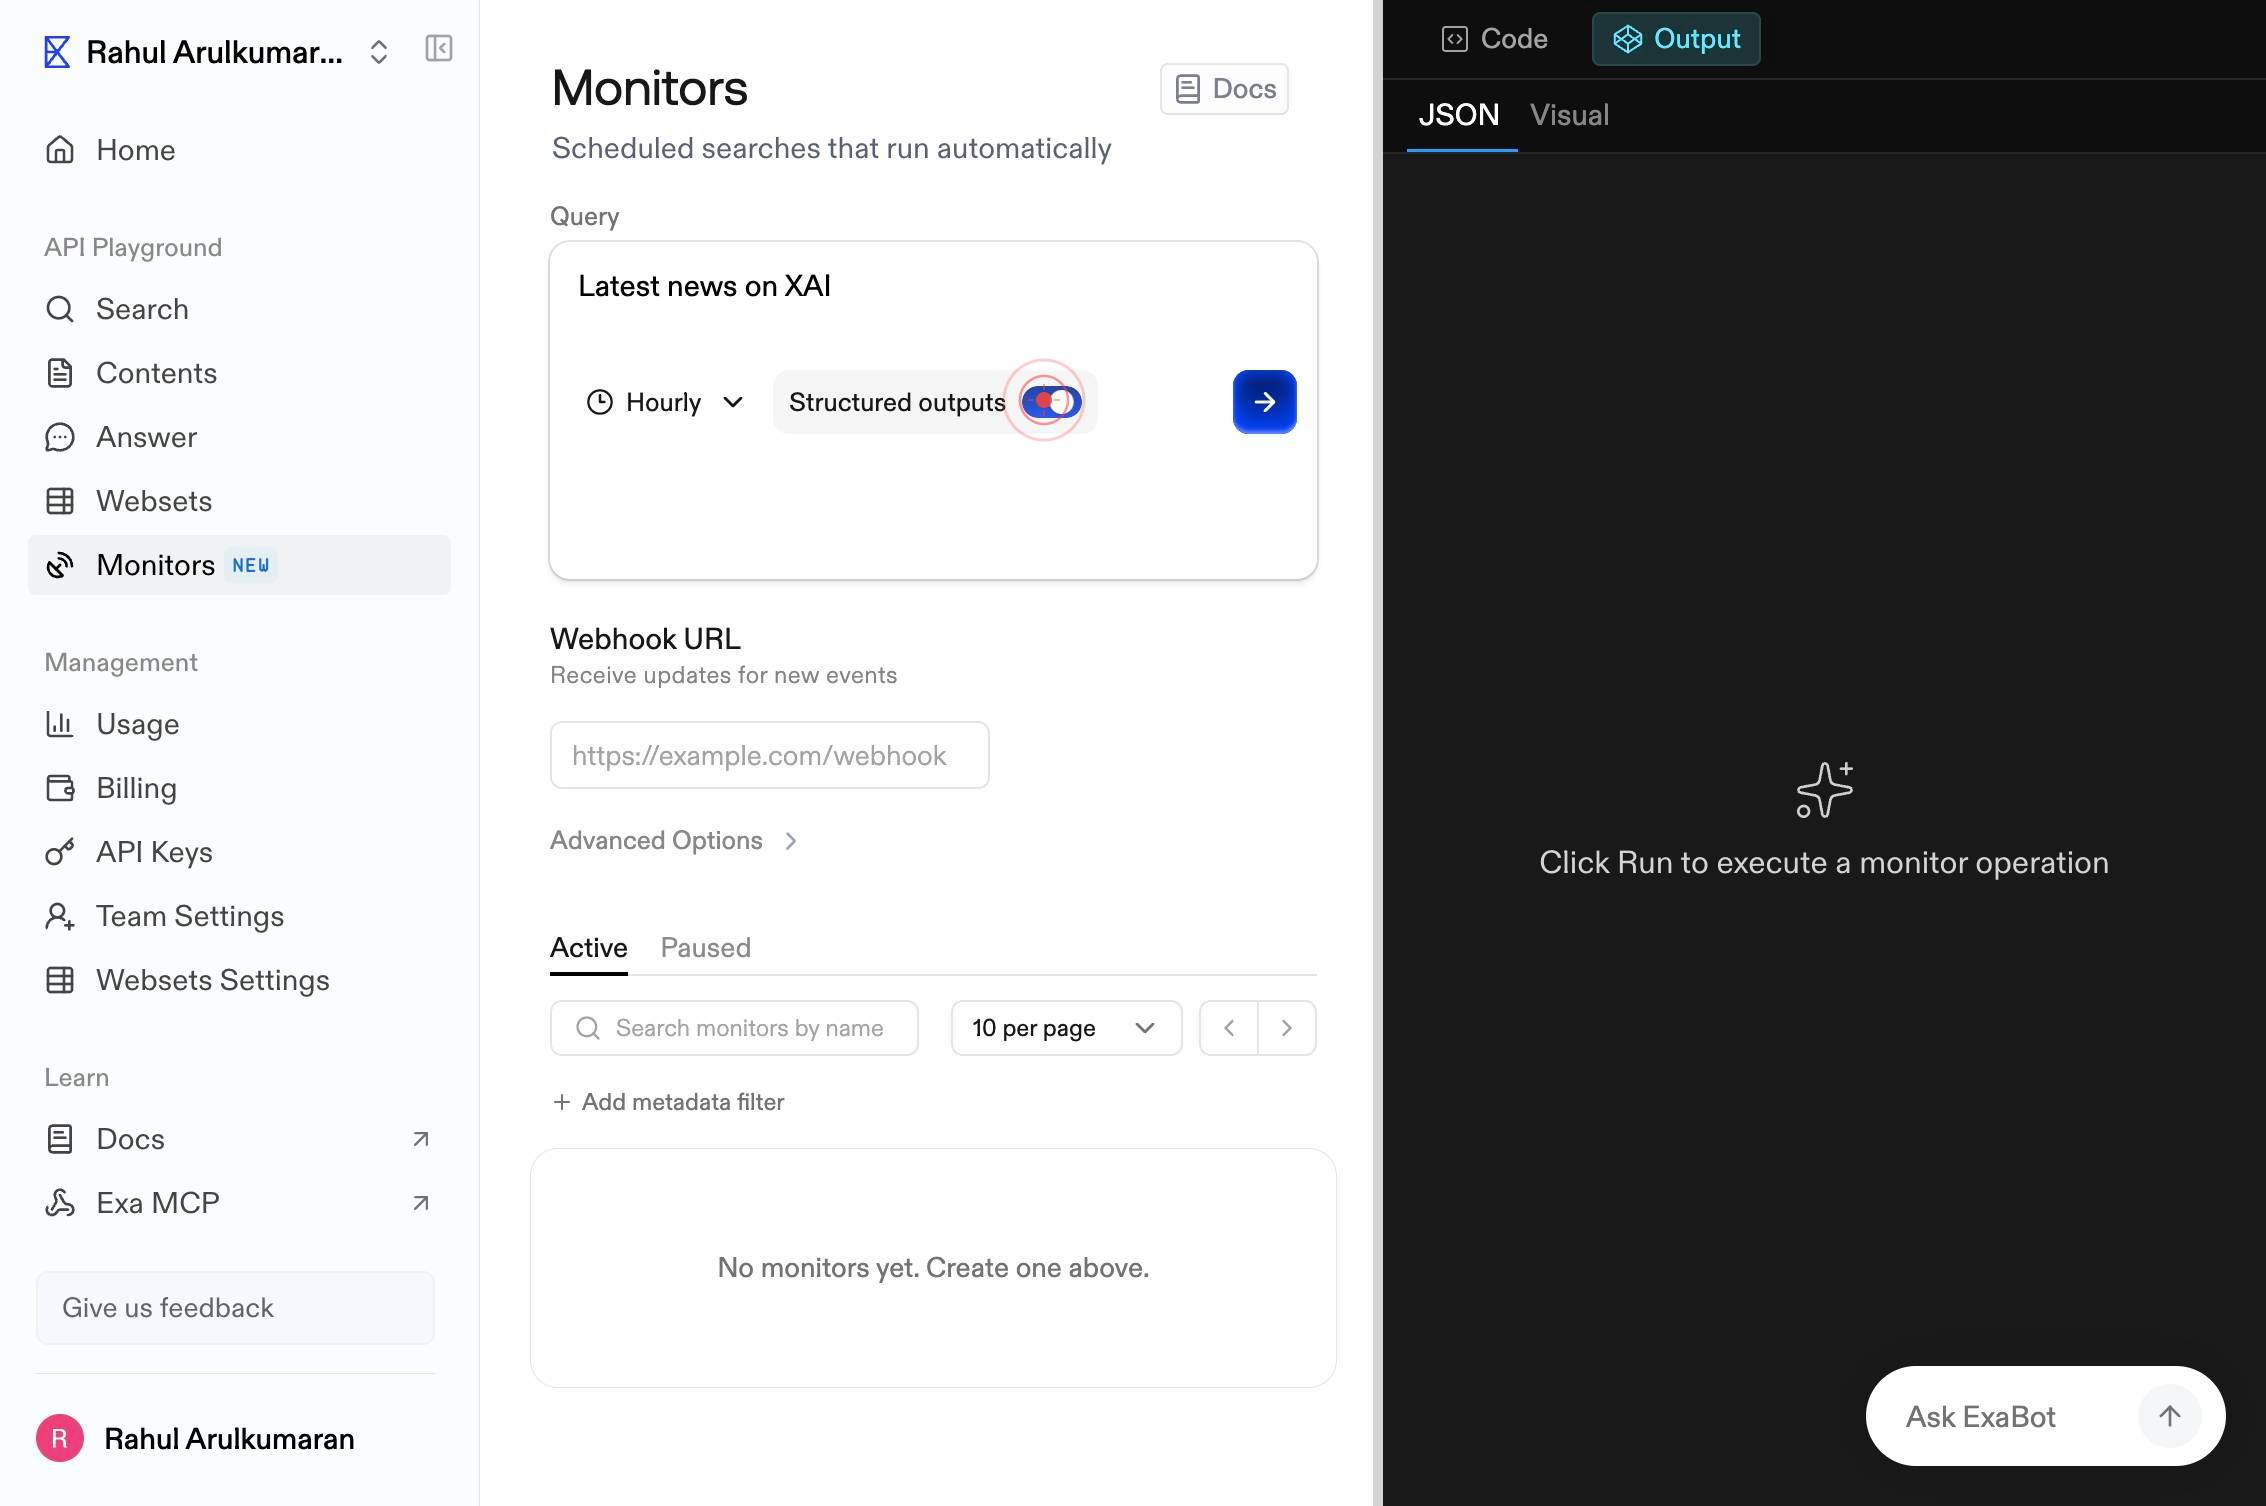
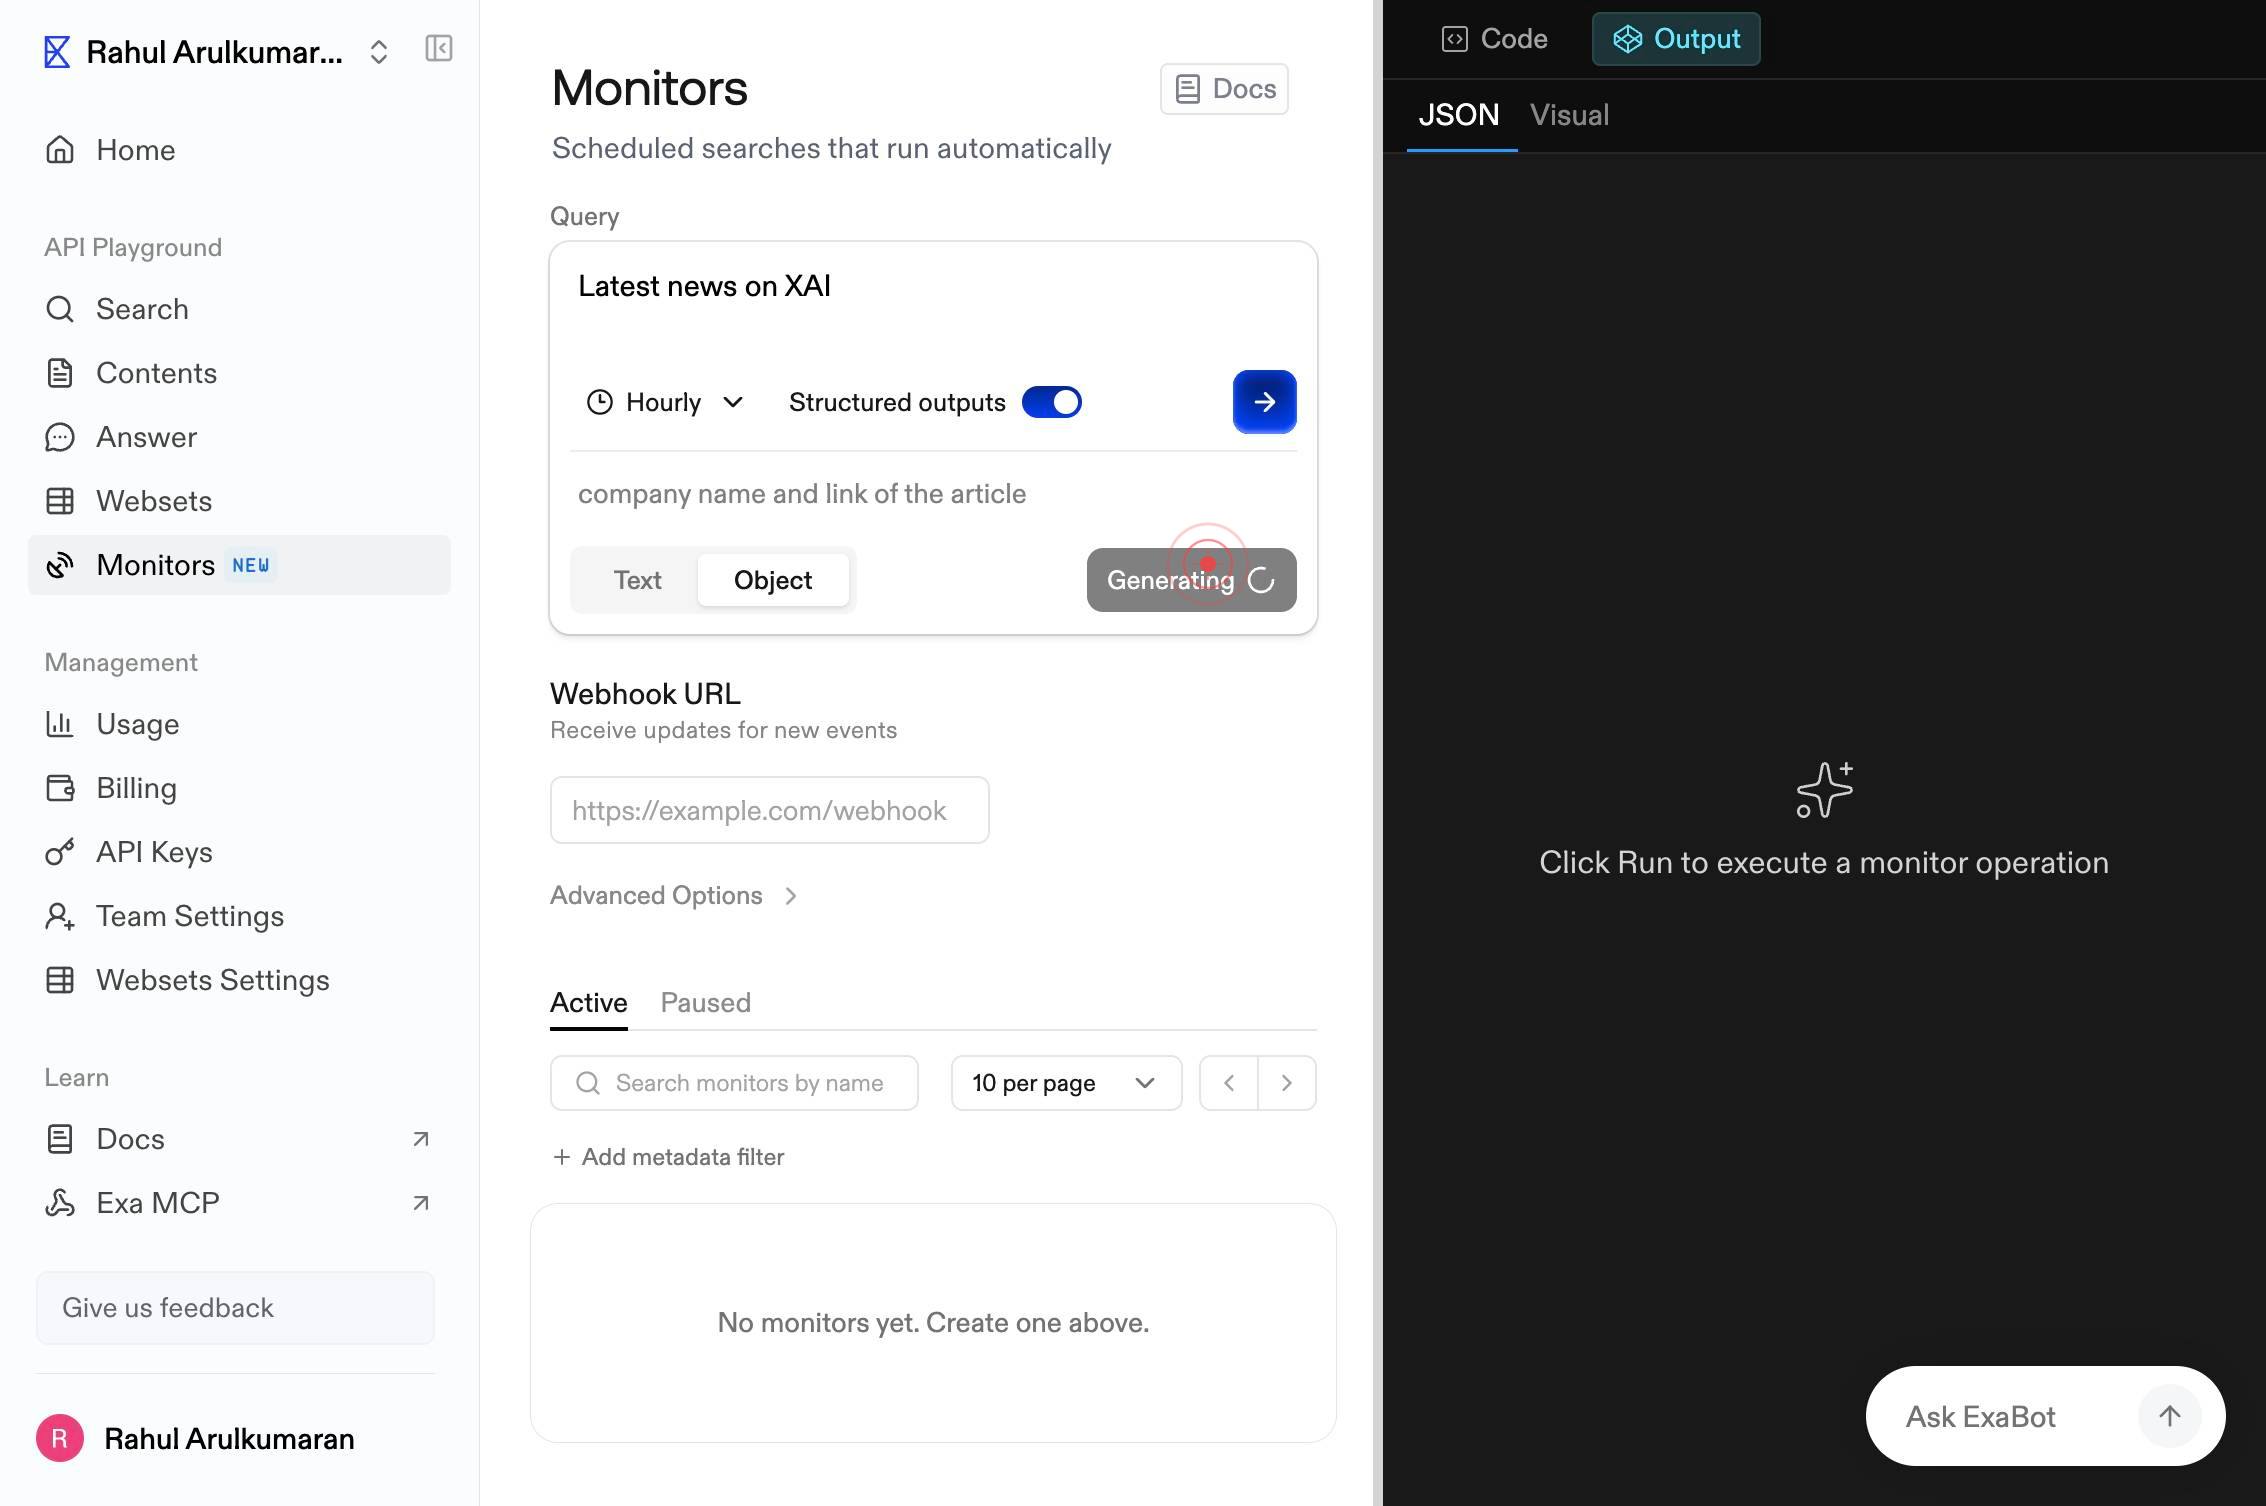
switchClick the toggle switch to enable JSON schema filtering. This allows you to define structured output requirements for the monitor's results (optional but recommended for precise data collection).
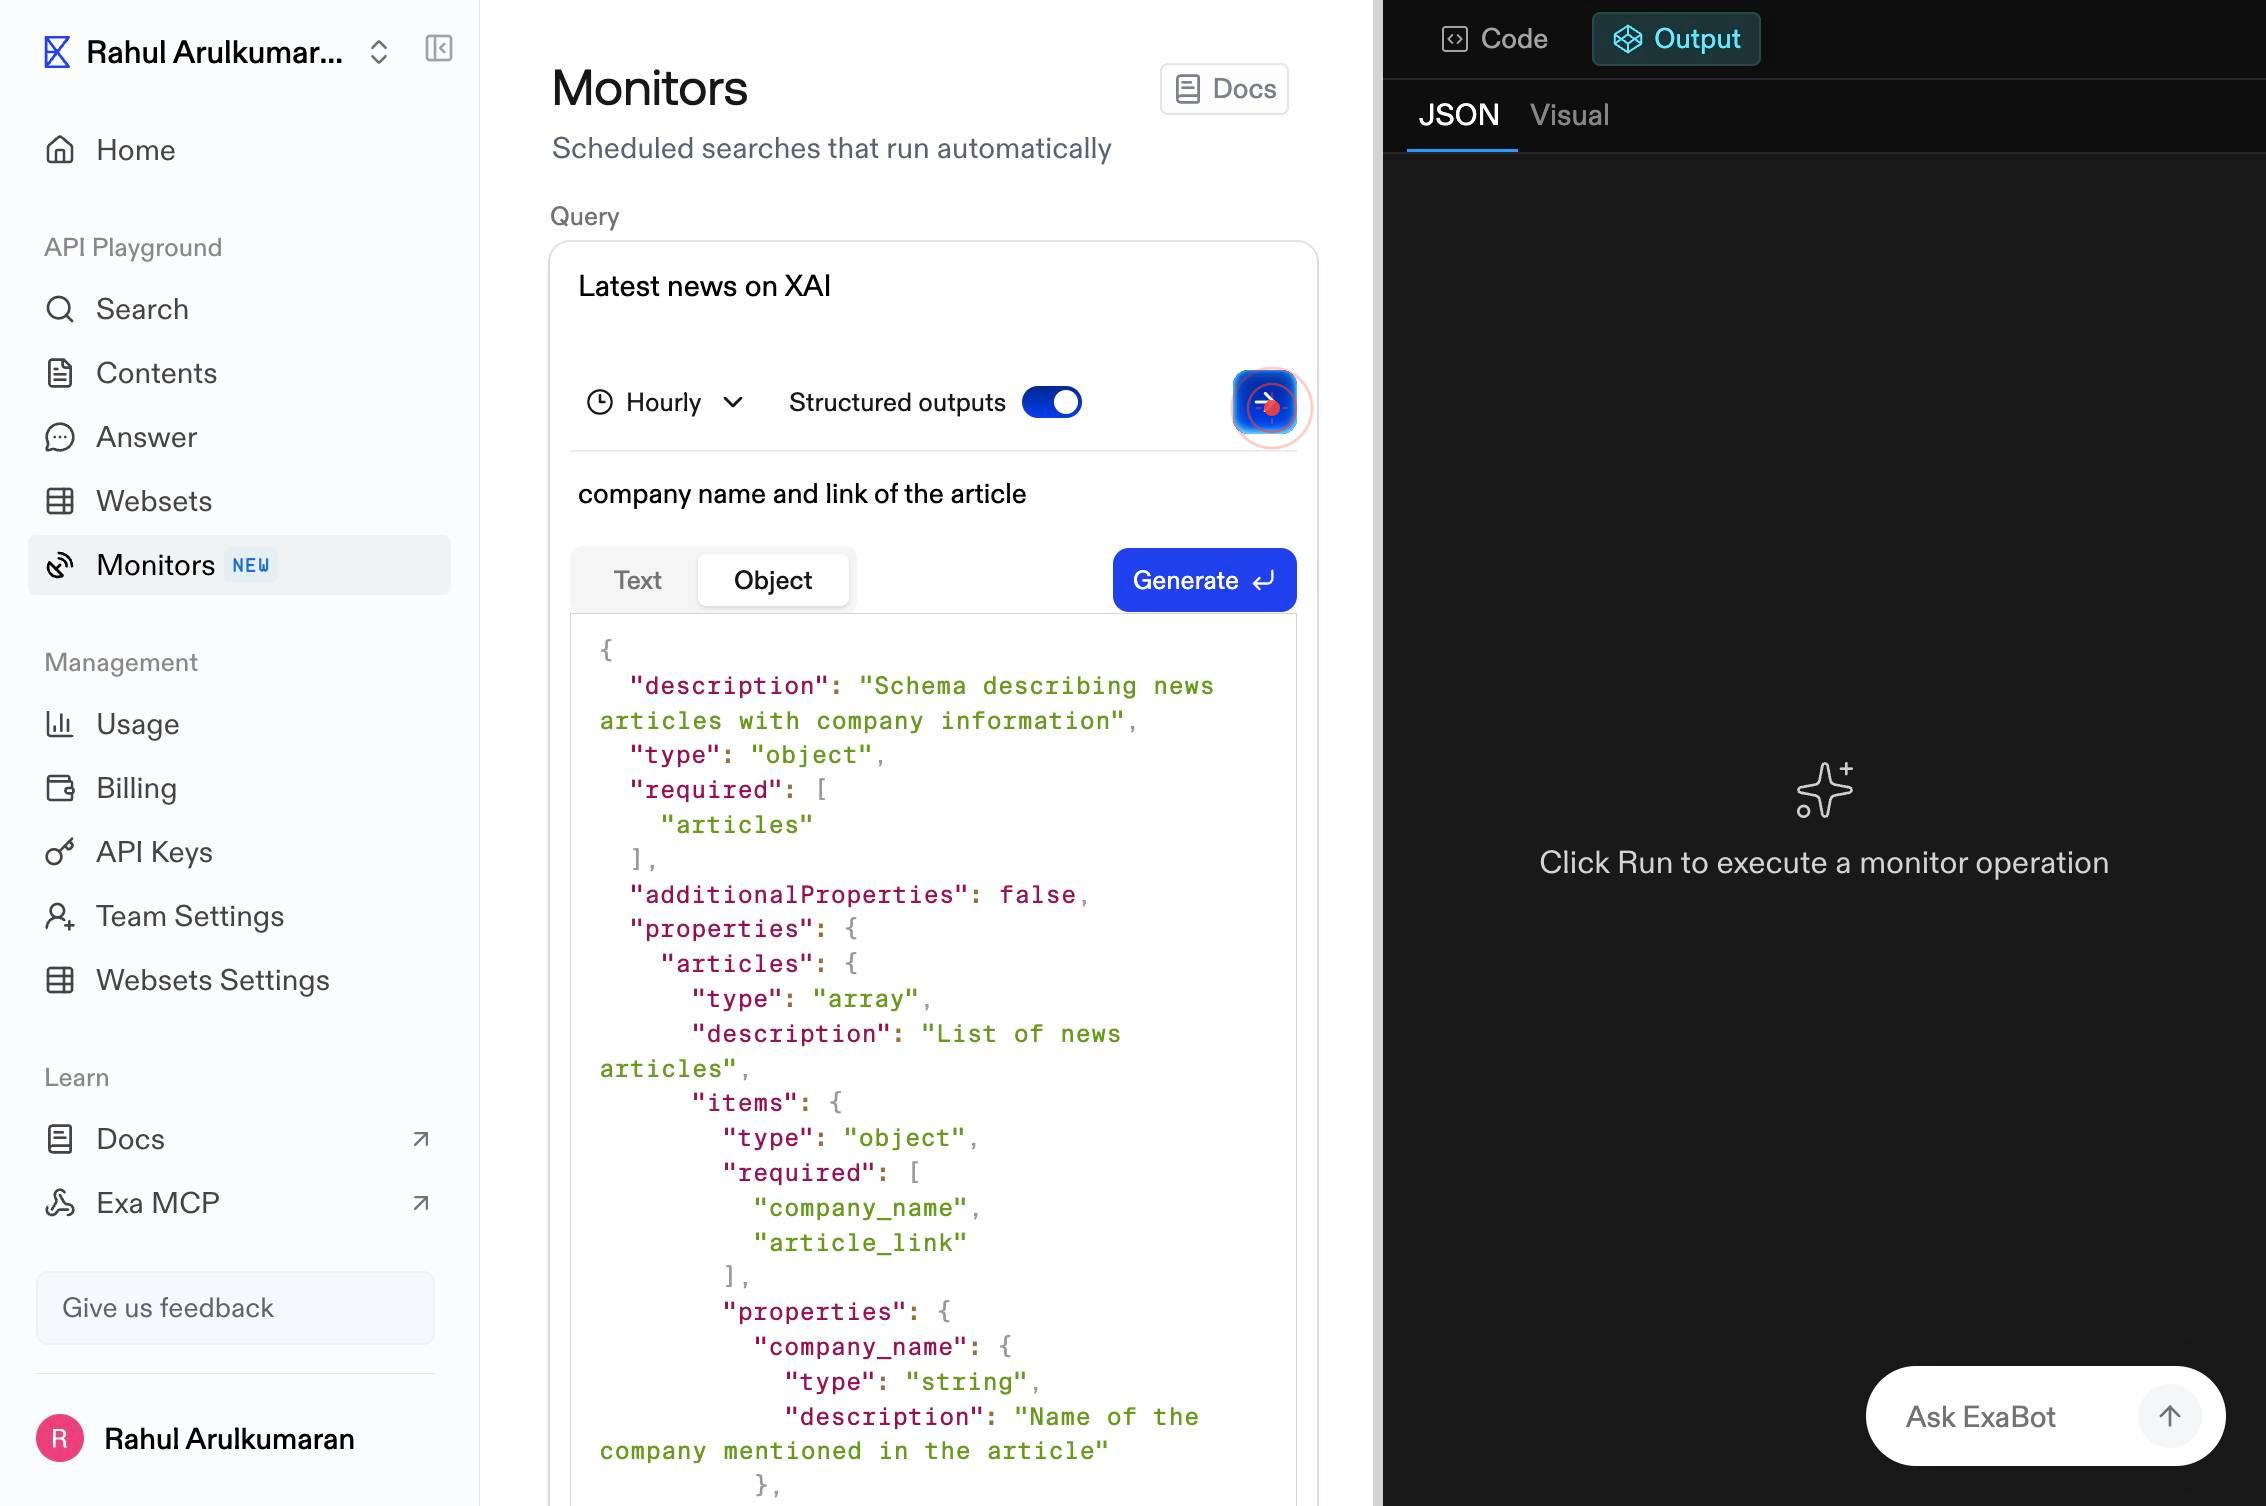
Describe the JSON schema you need or paste valid JSONClick on the JSON schema textbox (labeled 'Describe the JSON schema you need or paste valid JSON') and enter either a natural language description of your desired output format or a valid JSON schema object. This defines what data fields and structure you expect from monitor results.
GenerateClick the 'Generate' button to automatically convert your JSON schema description into a valid schema structure. This validates and formats your schema requirements.
Create monitorClick the 'Create monitor' button to finalize and activate your new monitor. The monitor will be saved and begin executing according to your specified frequency (hourly).
Confirm it worked
- 1After clicking 'Create monitor', you are redirected to the monitor detail page showing your newly created monitor with a confirmation message
- 2The monitor appears in your Monitors list on the dashboard with the correct name, frequency (Hourly), and schema settings
- 3The monitor status shows as 'Active' or 'Ready' and you can see the next scheduled run time
- 4You receive a confirmation that the monitor will begin executing at the next scheduled interval
Common issues
Keep reading
How to Create URL, API, SSL, and Heartbeat Monitors in 60 Seconds | MonitorPlatform Blog | MonitorPlatform
How to Create URL, API, SSL, and Heartbeat Monitors in 60 Seconds | MonitorPlatform Blog | MonitorPlatform [Back to Blog](https://monitorplatform.com/blog) Tutorials # How to Create URL, API, SSL,
monitorplatform.comCreate Monitors workflow
# Create Monitors workflow This page describes how to create Monitors. # How do I create a Monitor? You can create new Monitors in Observe from the Monitors list, from Explorers and Worksheets, fro
docs.observeinc.comCreate a New Monitor | Sumo Logic Docs
Create a New Monitor | Sumo Logic Docs On this page This guide will walk you through the steps of creating a monitor in Sumo Logic, from setting up trigger conditions to configuring advanced setting
help.sumologic.com